Lower the boundaries to create and train AI/ML models
Overview
The Synthetics team was a small group of individuals looking to build a novel solution for training computer vision models. I came on as the sole designer to help craft a more intuitive experience by ideating on previous designs and refining the overall direction.
Role
Lead UX Designer
Timeline
4 months
The challenge
Training ML models take a large amount of data, time, and specialized skills leading to long timelines and barriers to entry for some organizations and people
What is Synthetics?
A small team building a tool that allows digital artists to create 3D models of real-world objects and synthetically put that object into various environments with different conditions such as lighting, backgrounds, and orientations to train ML models without requiring real-world training data.
This digital training data was scalable, perfectly labeled, and allowed for quicker training cycles.

What we’ve learned
Customers are entering from ML teams, where talent is in demand and supply is low
Real world data does not scale
Dataset iteration is a new process
Solution goals

Template based solutions
Allowing users to select from pre-made templates affords the ability to do much of the heavy lifting before the user starts

Shorter iteration cycles
Iterating on training sets for ML models is necessary, but there is an opportunity to reduce the time between cycles

Improve the debugging process
The debugging step requires highly trained ML experts currently; we aim to provide tools so more people to do this
Target users

ML Model Experts
Domain Familiarity
Knows about the entire creation process
Knows how to debug

Digital Artist
Low knowledge of ML model training process
3D modeling/environment expert
Does not know how to debug
The previous MVP
The team had already created a proof-of-concept using existing tools to prove that this new approach was possible
Initial thoughts
Going through previous concepts with the team, I was able to identify where they wanted to go, the problems they faced, and uncover potential design opportunities


Ideation & Refinement
Starting with pen and paper, I worked with key stakeholders to reimagine the framework of this new tool incorporating feedback and refining the concept
Sketching
Used low-fidelity sketches to work quickly and efficiently to include all the necessary parts

Refining layout
Created wireframes with more real-world data to validate design frameworks and determine information hierarchy

Finalized framework
Refined content layout and product flow based on continuous stakeholder back-and-forth

Final design
I was able to successfully deliver on building a comprehensive design encompassing all the product's key user flows and provide a prototype to be used to pitch further investment from leadership

The home page
The home page allows users to choose premade templates to kick off their training projects. They can choose from different categories and start a project with a sample model or import their own.

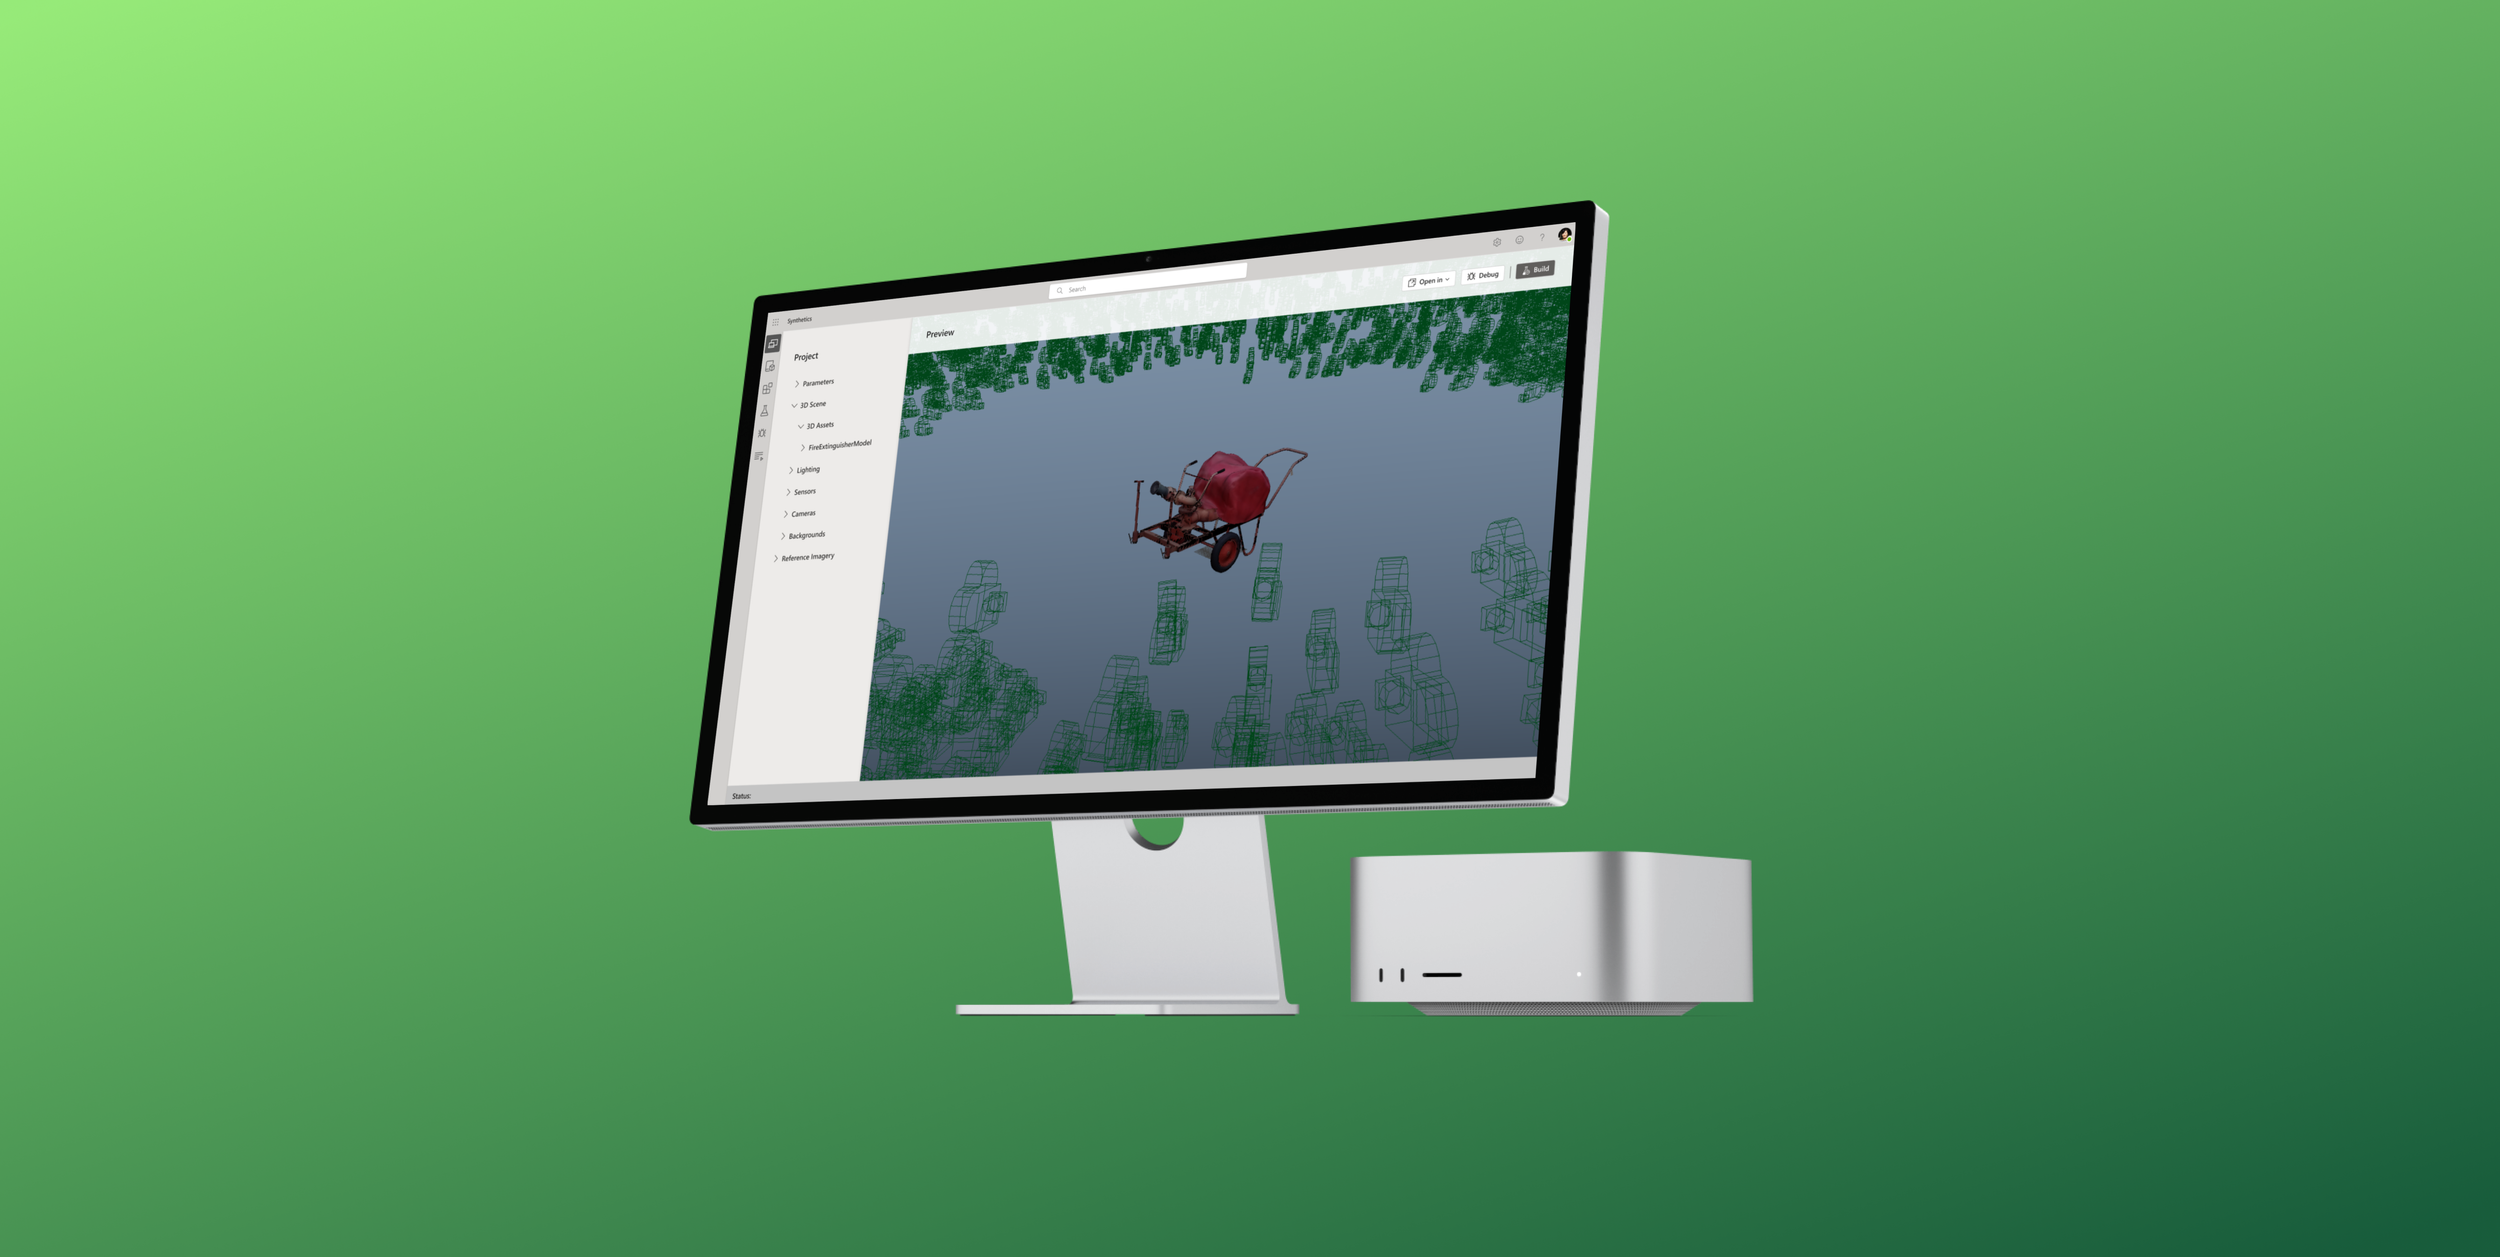
A new view
Giving users a 3D perspective into how their digital object will be turned into training data

Plug-ins for the best 3rd party tools
Allowing users to leverage the industry-leading tools they are accustomed to

Asset libraries
Catalogs of digital objects, lighting, sensor, camera, and background packages

Debugging made easy
An intuitive way to understand how each build performs and, most importantly, a way to understand what went wrong
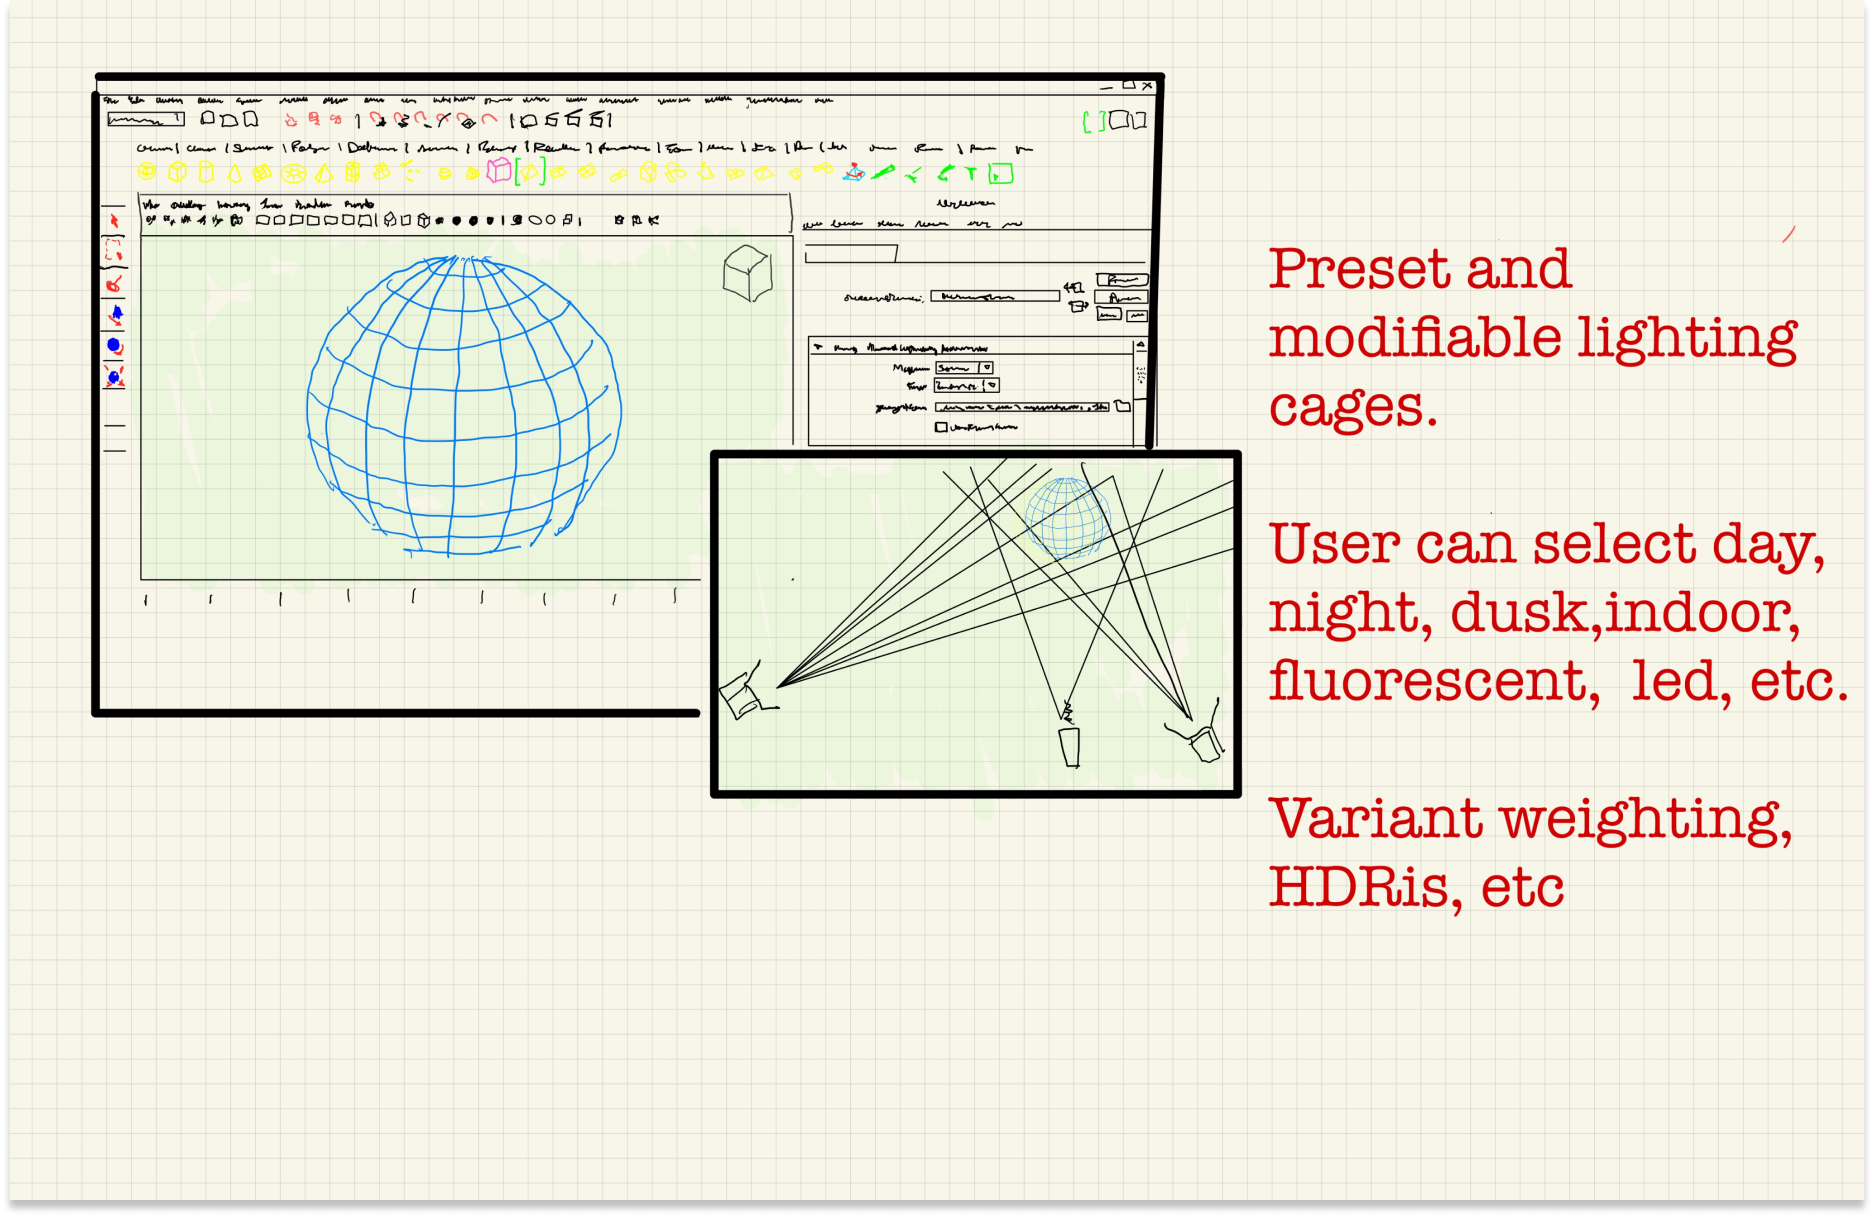
The debugging feature
The debugging feature was a massive area of opportunity for design innovation. After learning how it's currently handled, we realized there were very few best practices in place, and it requires an individual with immense AI/ML knowledge and training.

First approach
First iterations were focused on individual instances and aimed to communicate what the model was seeing
This was helpful but did a poor job of highlighting patterns from the whole training set
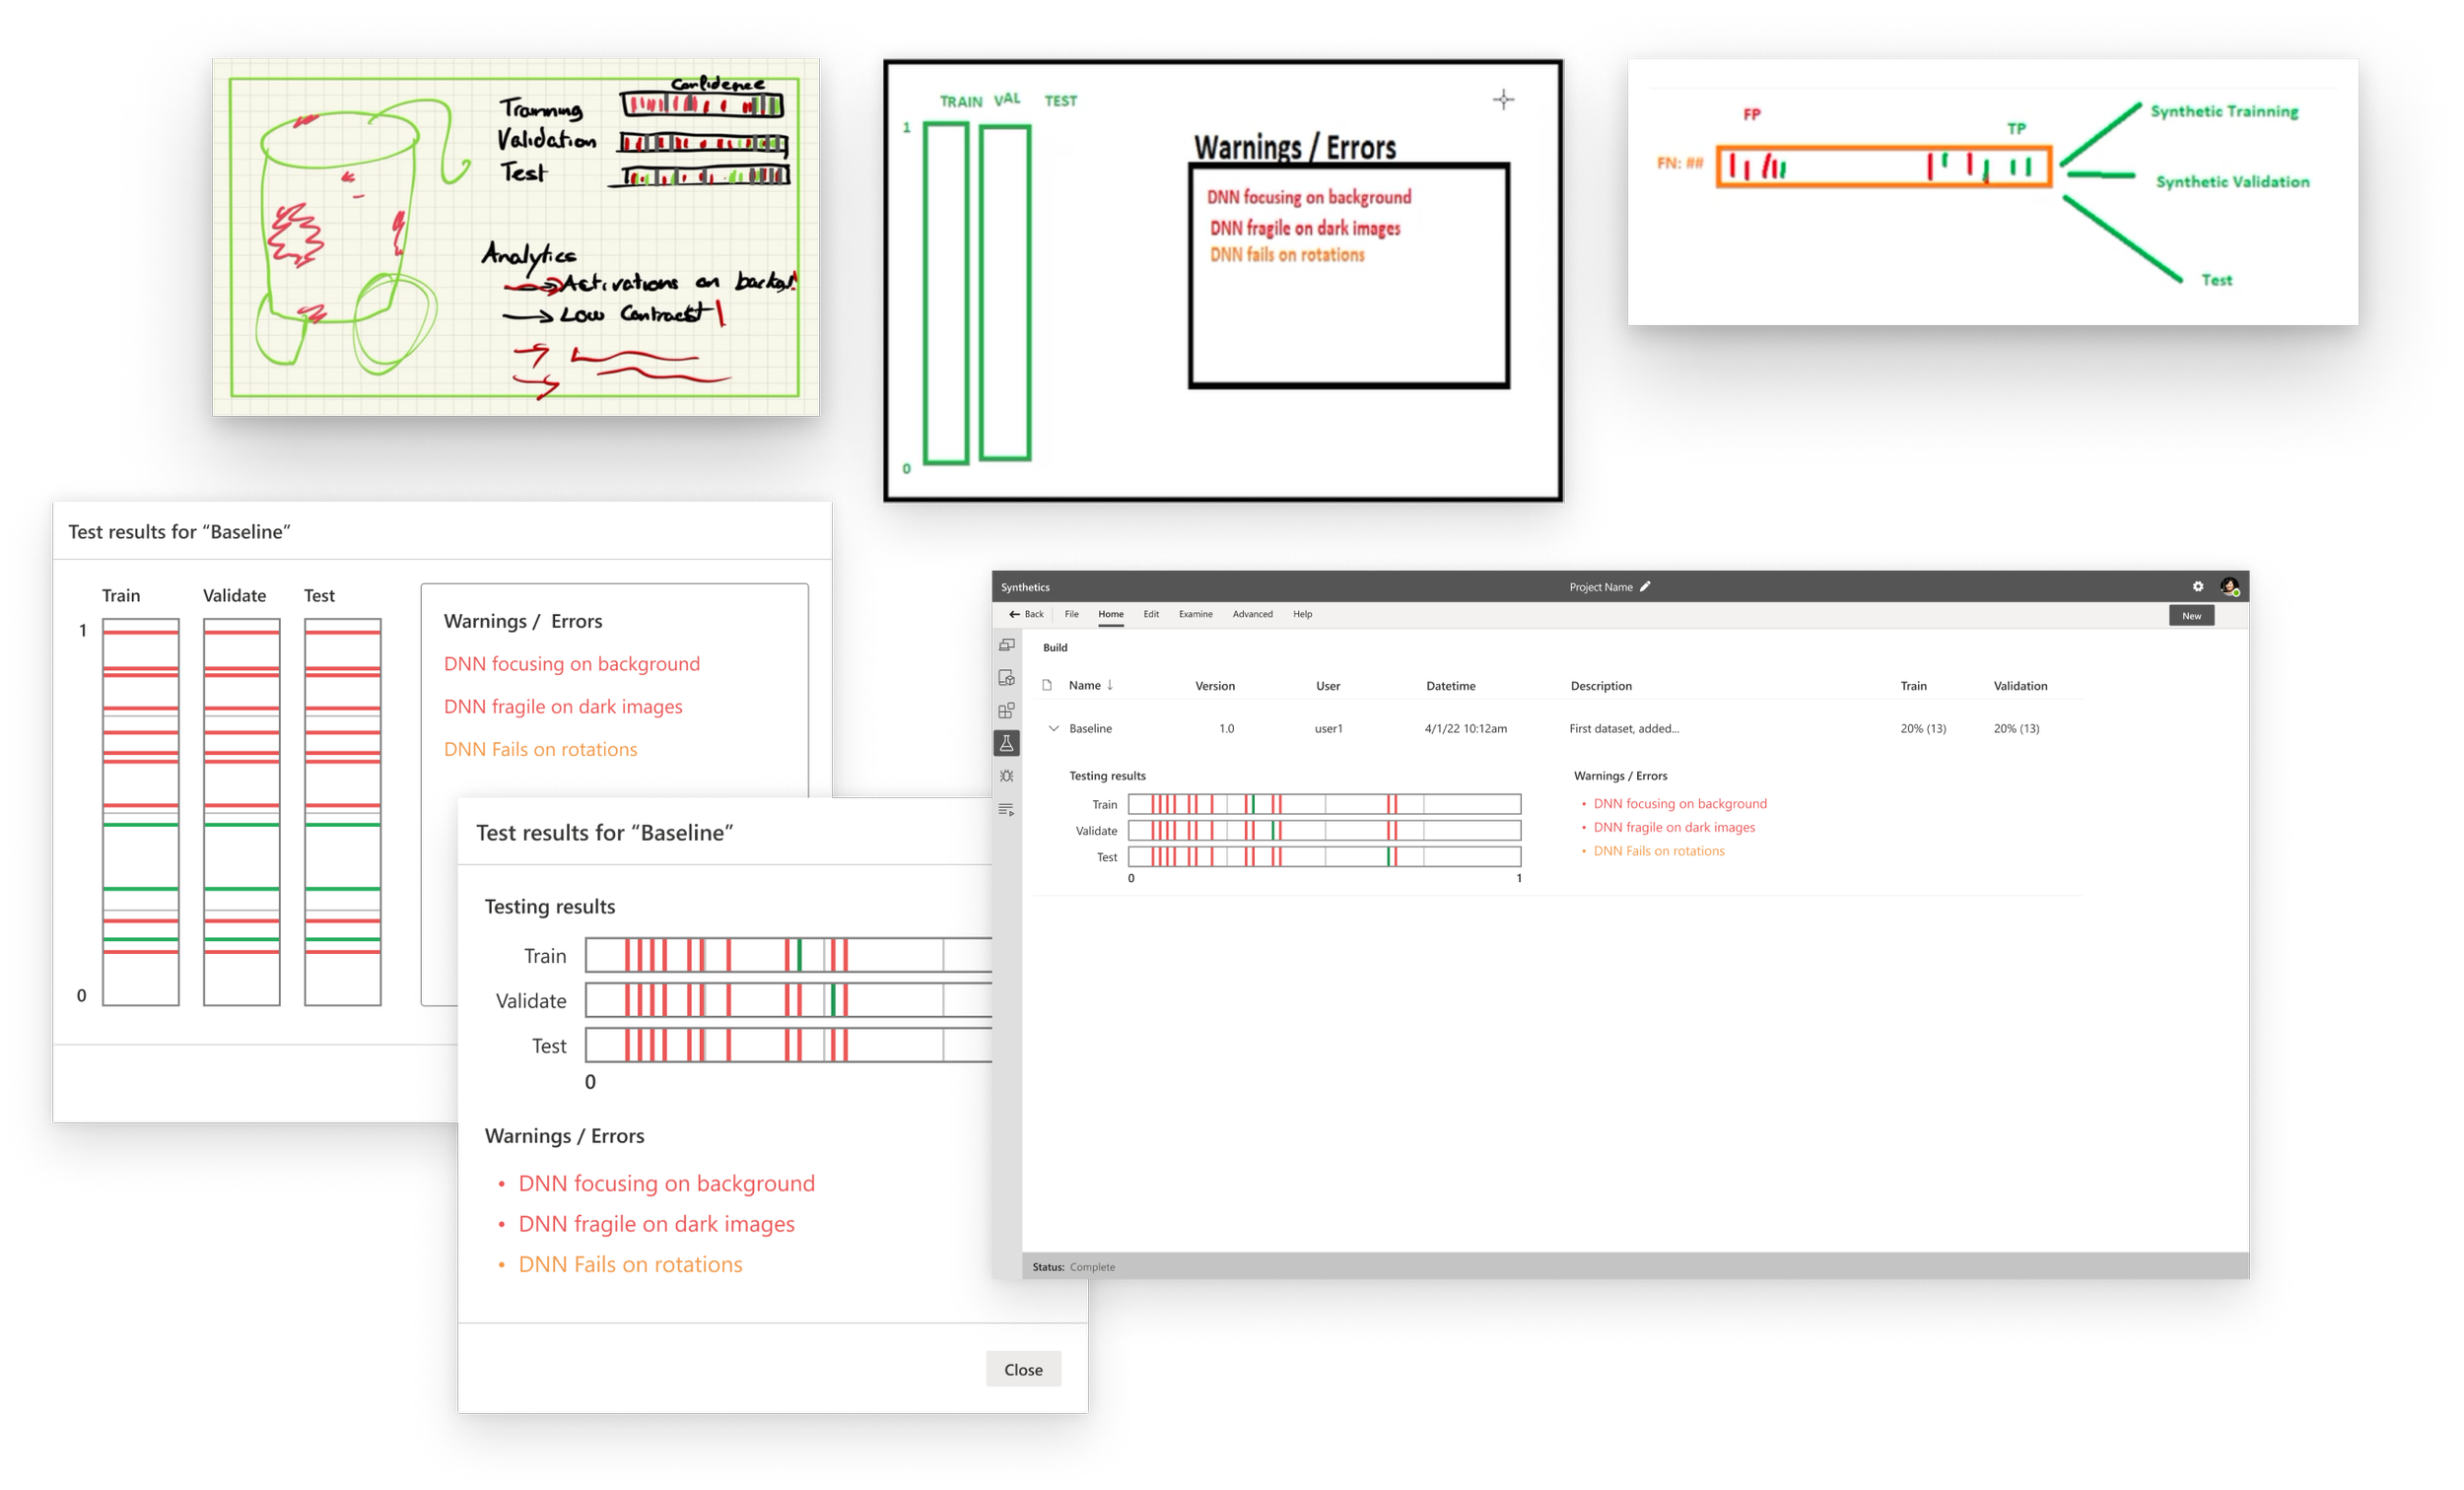
Going back to the drawing board…
Focusing on surfacing insights to the user about where the model was failing
Designing to give a health check for the entire training cycle

Final debugging feature
This histogram approach allowed for a better high-level understanding of each training cycle and communicated where the model was having issues
What we accomplished
In a short amount of time, we were able to get buy-in from key stakeholders with the improved designs for Synthetics. Training computer vision models started with a highly manual process requiring much of the effort spent on establishing infrastructure. We reduced the time spent training models from months to just days, completely removing the manual component.
Impact
Democratizing computer vision model creation
3D artists can now train ML models
Reduced the iteration cycle from months to days
Lessons Learned
Designing novel tools is an iterative process
Model Explainability is key
As ML tools evolve, so do the users