

Add transparency and explainability to the ML models used on our platform

Overview
The Science Engine is a robust platform that allows our users to apply ML models to their workflows.
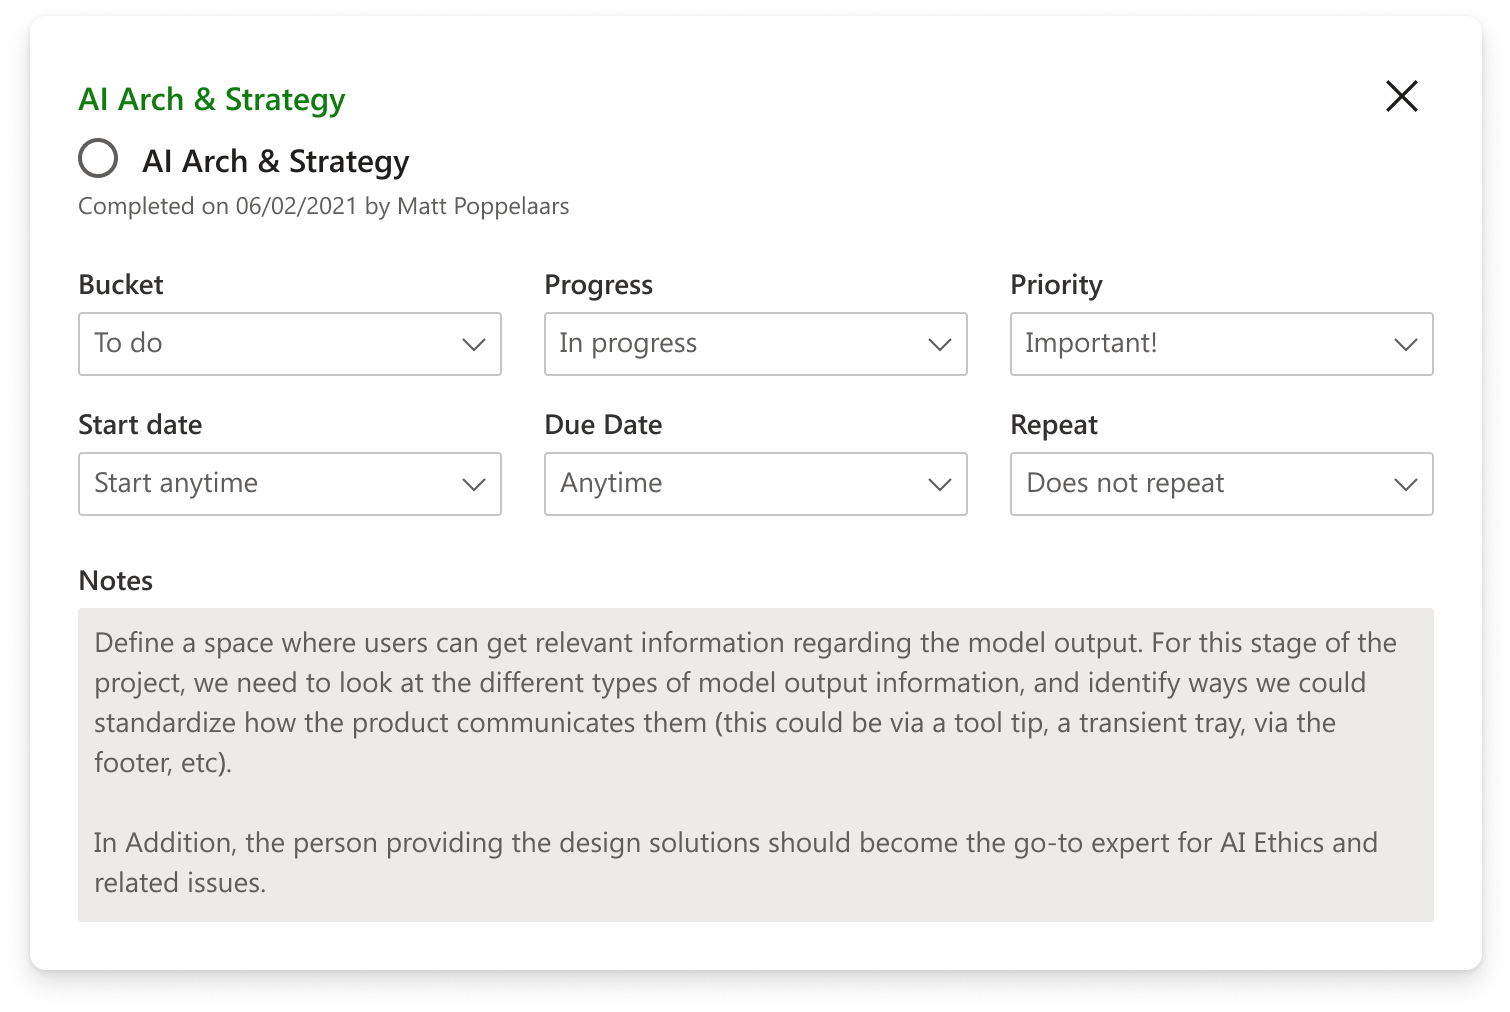
Our users must understand how these models work to trust their outputs. It is critical for any product that leverages AI/ML to have an ethical approach to transparency and explainability. I was responsible for leading this project's design efforts, including problem definition, ideation through design refinement, contributing to the user testing plan, and handing off the high-fidelity design specs.
Role
Lead UX Designer
Timeline
3 months - on going
The challenge
How can we improve the transparency and explainability of our machine learning models to build trust in the platform?
Science Engine

Add data
Users bring in many different types of data from various locations
They can manipulate some of the data coming into our product
They have access to public data sources

Apply ML models
Users apply ML models through a formula bar
They connect the models to the data sources
The model’s parameters can be manipulated by the user

Get insights
Discover connections among larger quantities of information
New ways of searching and filtering through mountains of data
Perform powerful functions such as batch object extraction
Project background
As a product that allows users to apply AI models to their data, we must allow users to achieve their goals by better understanding how an AI system works throughout definition, development, deployment, and ongoing interaction.
There is a need to uphold Microsoft's Transparency principle for AI.

AI & ML
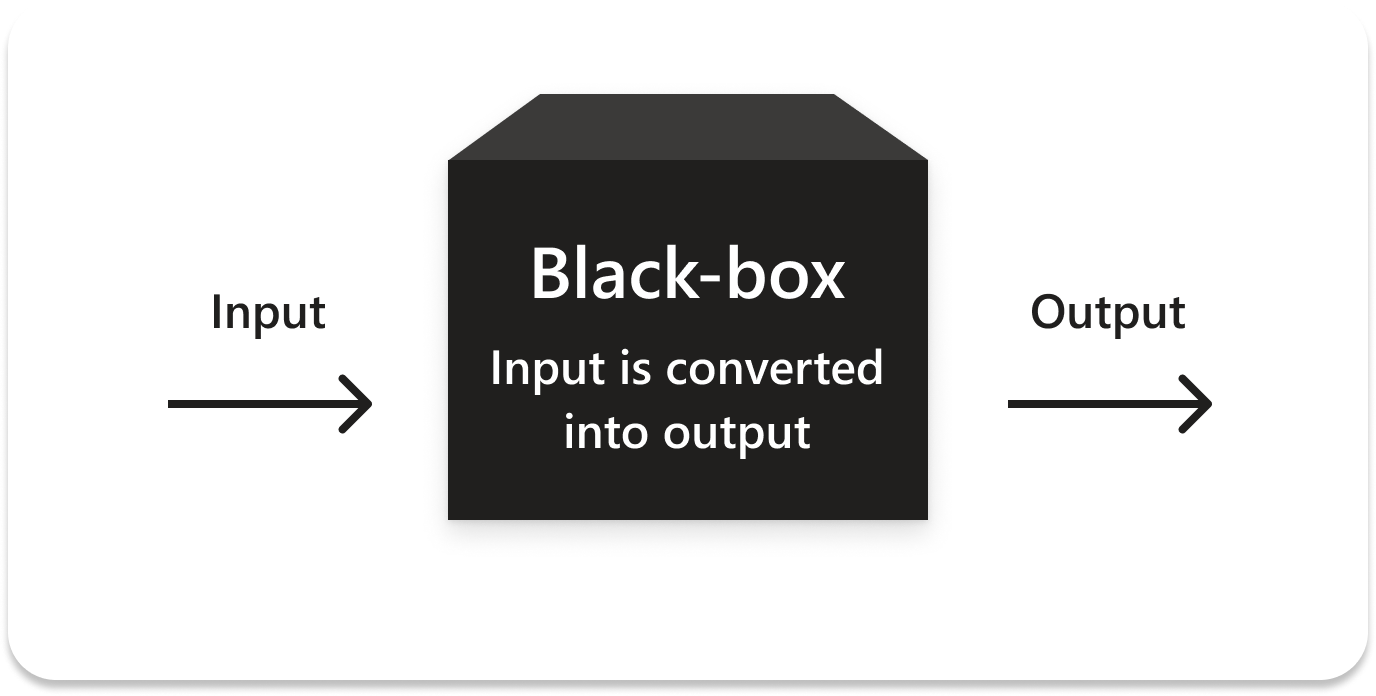
Black-box models
Black-box models, such as Neural Networks, often provide excellent accuracy but the inner workings of these models are harder to understand.
Project goals
Interpret
Include information that allows users to understand complicated machine learning functions as much as possible
Trust
Provide our customers with information about the intended uses, capabilities, and limitations of our AI platform services
Prevent
AI system behavior should be understood so people can identify potential performance issues, safety, and privacy concerns, biases, exclusionary practices, or unintended outcomes
Target users

SME Scientists
Discovering connections
Validating a hypothesis
Identifying meaningful signals
Making informed predictions

Info Investigators
Finding something similar
Comparing resources
Summarizing various resources
Collaboration
The Science Engine is a powerful platform that allows our users to apply ML aggressive milestone
Applied Scientists
Syncing with our Machine Learning Scientists to understand the problem and what data we could surface

User Research
Collaborating with our research team to pin point the real user problem and help facilitate testing exercises

Design Team
Reviewing design concepts with the fellow designers on my team allowed for a new design library component to be created

Program Management
Prioritizing feature characteristics for a first version of this project by outlining what we were able to surface to the user by the time of the targeted release

Expanding the scope
The original task assigned to me was for a simple design to show model output information.
After speaking with stakeholders and learning about constraints, requirements, and user needs, I pushed for a more comprehensive solution.
Progressive disclosure

The formula drop-down
Supporting model descriptions as the user types in the formula bar
Light-weight information giving several key meta-data points

The model
transparency panel
Shows information on the model that is applied to the page currently in view
It gives much more supporting model information
The user has access to model information and performance metrics

The model catalog
The most information on models
It contains all information on all models on our platform
Users can deep-dive into specific models and explore new ones
Design exploration
Refining the designs of each touchpoint through testing with customers and getting sign-off from key stakeholders

Final design
Using progressive disclosure in our design approach, we identified vital touchpoints a user has with models in our product. This solution helps provide the right amount of information at the correct time and allows the user to dive deeper depending on their need.

Formula drop-down
Showing a small amount of information about the model entered in the formula bar

Right-side transparency tray
Giving the user data on the applied model such as model description and performance metrics
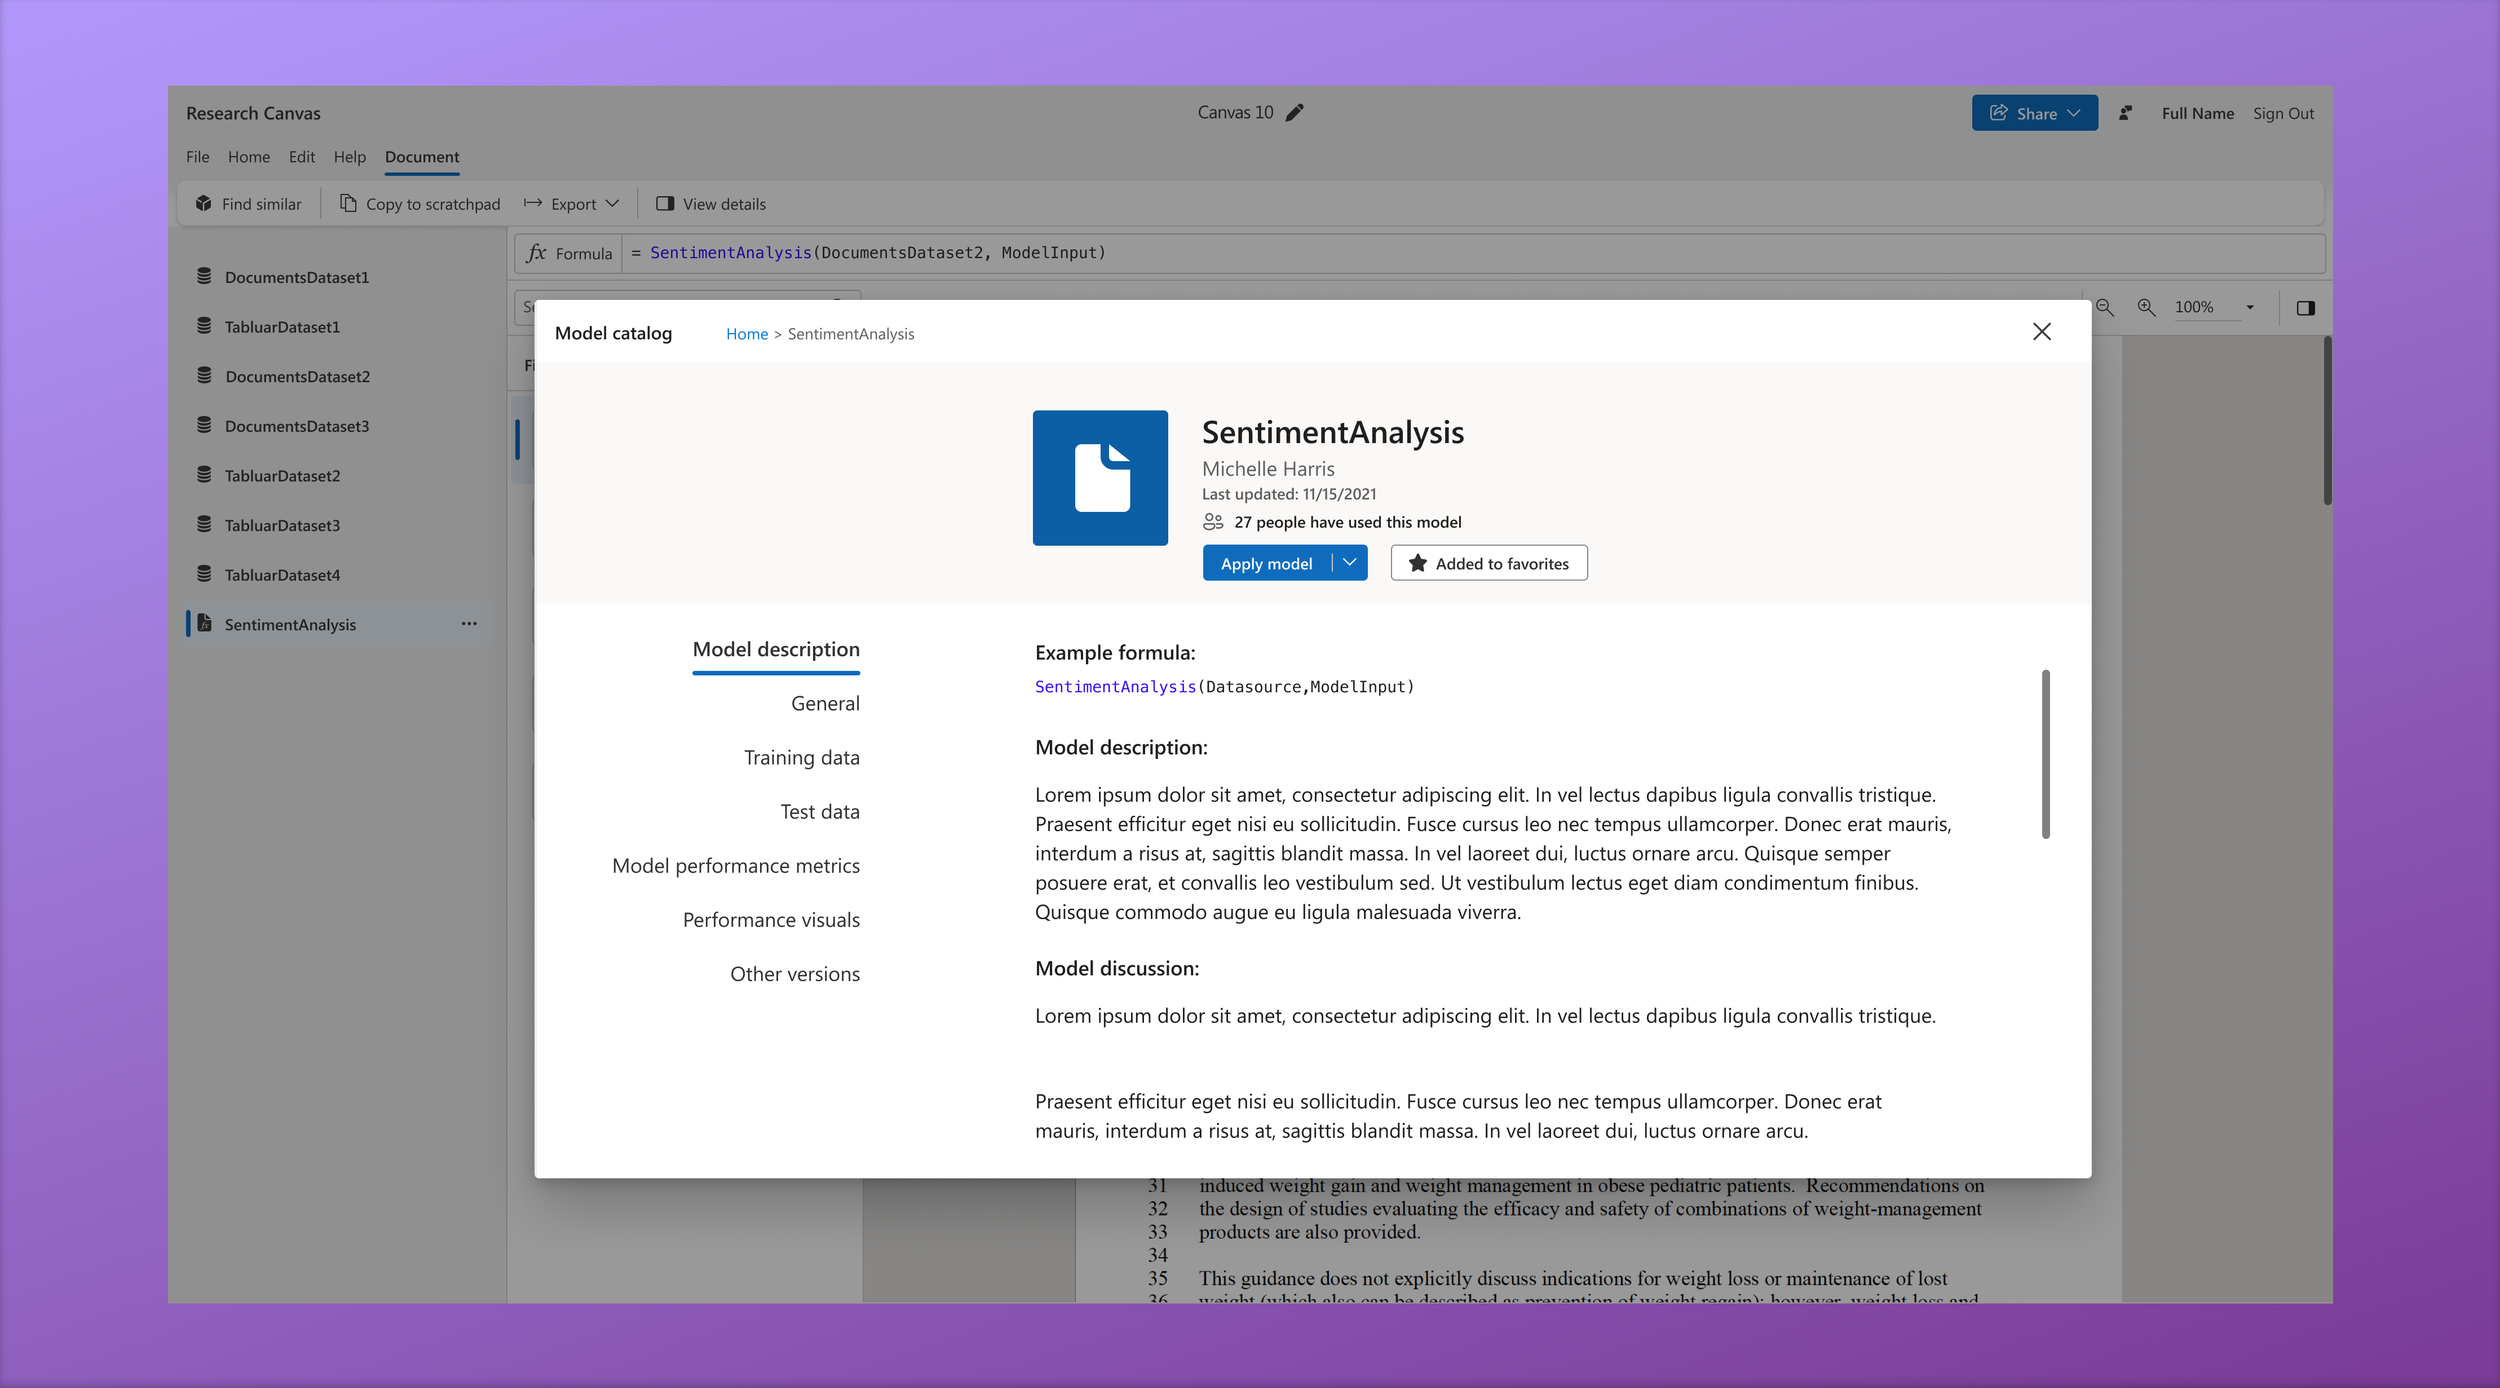
Model Catalog
The deepest dive of info related to all the models users have access to on our platform
Information panel
The transparency tray expands out from the right side without obscuring any workplace content so the user can read model info inline with their work
Tray content
The model transparency tray groups information into general info such as description, owner, testing/training data, etc as well as performance metrics
Exploring model catalog
Users can navigate through the model catalog to discover new models and view all the data we have about any specific one
Impact
New platform functionality that supports Microsoft’s mission of responsible AI
We created a new shared design system component
Increased the transparency of our models
Became the point person for all things model transparency related
Lessons Learned
Show the right info at the right time
Users are more forgiving if they understand how a model works
Transparency is an ongoing process